

Comment Finalyse peut vous aider
Designed to meet ECB requirements asking banks to perform comprehensive, sound, and forward-looking physical risk assessments.
Designed to incorporate climate-related and environmental risk considerations into your risk management, governance, ICAAP and disclosures
Finalyse Physical Risk Prototype - A case study on fluvial flood risk for residential real estate exposures in Belgium, France and the Netherlands
INTRODUCTION
Following the adoption of the Paris Agreement on climate change and the UN 2030 Agenda for Sustainable Development in 2015, governments are trying to make strides to transition to low-carbon and more circular economies on a global scale. On the European front, the European Green Deal sets out the objective of making Europe the first climate-neutral continent by 2050. The financial sector is expected to play a key role in this respect.
Since 2019, the European Central Bank (ECB) has identified climate-related risks as a key risk driver in the SSM Risk Map for the euro area banking system[1]. The ECB is of the view that institutions should take a strategic, forward-looking and comprehensive approach to considering climate-related and environmental risks (C&E risks).
This article will focus on physical risks, such as physical damages caused by climate change and environmental degradation, which can have a significant impact on the real economy and the financial system.
Physical risks need to be carefully assessed by the financial institutions, which are required to develop proper methodologies and action plans to integrate them in their Risk Management Framework.
The objective of this article is to present a practical implementation of a physical risk assessment using the recently developed Finalyse Flood Risk Prototype. Following the ECB requirements[2] on the identification of C&E risks, Finalyse developed a prototype to demonstrate how banks should quantify their physical risks focusing - in a first stage - on the physical risk assessments for flooding.
After a brief overview of the regulatory background - which led to the methodological assumptions underlying the development of the Flood Risk Prototype - the discussion will concentrate on the technical functionalities of the tool and an application of the prototype on an actual portfolio will be presented in order to quantify the impact of fluvial flood risk on the capital requirements of financial institutions.
REGULATORY BACKGROUND
In November 2020, the ECB published the Guide on climate-related and environmental risks(hereinafter, the Guide), providing an overview of 13 recommendations related to Strategy, Governance, Risk management and Disclosures on C&E risks.
The Guide describes how the ECB expects institutions to consider climate-related and environmental risks – as drivers of existing categories of risk – when formulating and implementing their business strategy, governance and risk management frameworks. It further explains how the ECB expects institutions to become more transparent by enhancing their climate-related and environmental disclosures and financial institutions are expected to fully comply with them. Since then, an increasing number of national regulators and supervisors have also formulated similar expectations.
Furthering its purpose to develop a supervisory approach to manage and disclose climate-related and environmental risks, in 2022, the ECB launched the thematic review, which involved conducting deep dives into the institutions’ climate-related and environmental strategies.
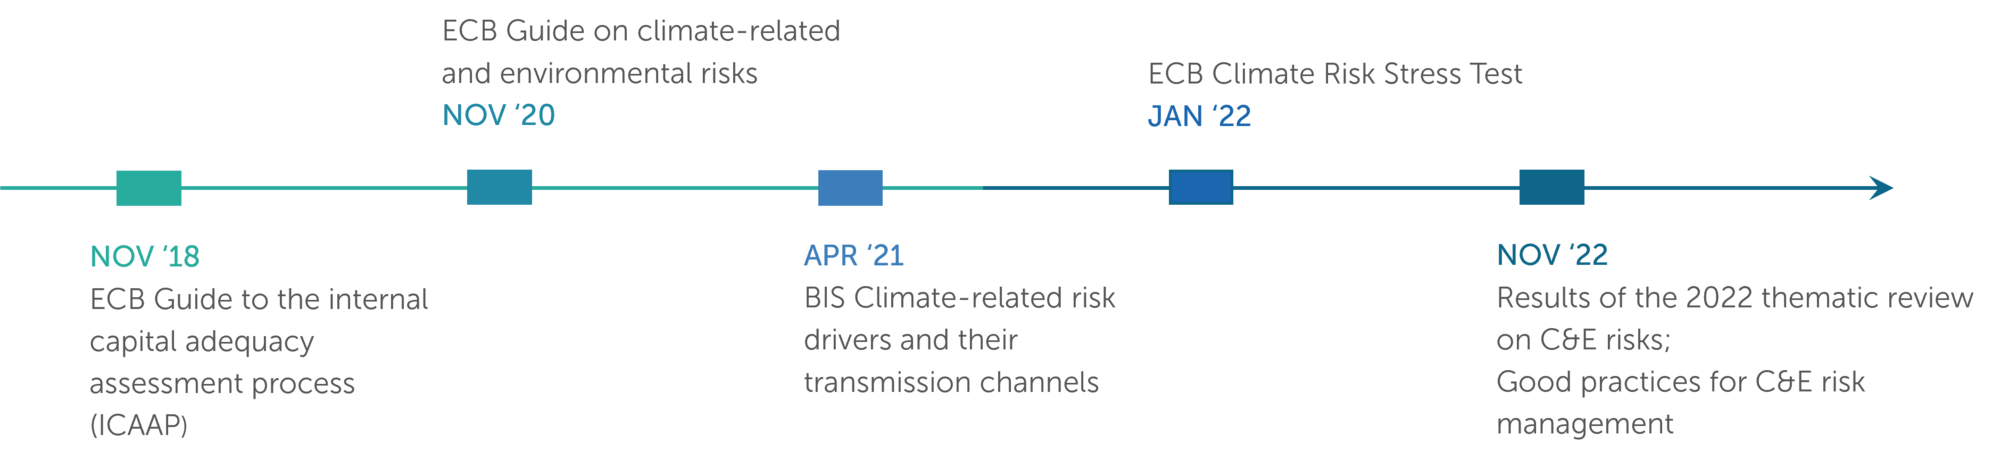
The results of the 2022 Thematic review on C&E risks[3] showed that, despite a global improvement of the banking sector’s response to C&E risks, implemented practices do not always reach the desired level of soundness, comprehensiveness, or effectiveness. However, the ECB sees reasonable that banks can be fully compliant with all the expectations by the end of 2024 at the latest.
Supervisory Expectations on Physical Risk Assessment
In the context of developing a comprehensive approach for the assessment and quantification of the impact stemming from climate-related risks on institutions’ business environment, relevant indications can be directly found in the ECB Guide on C&E risks.
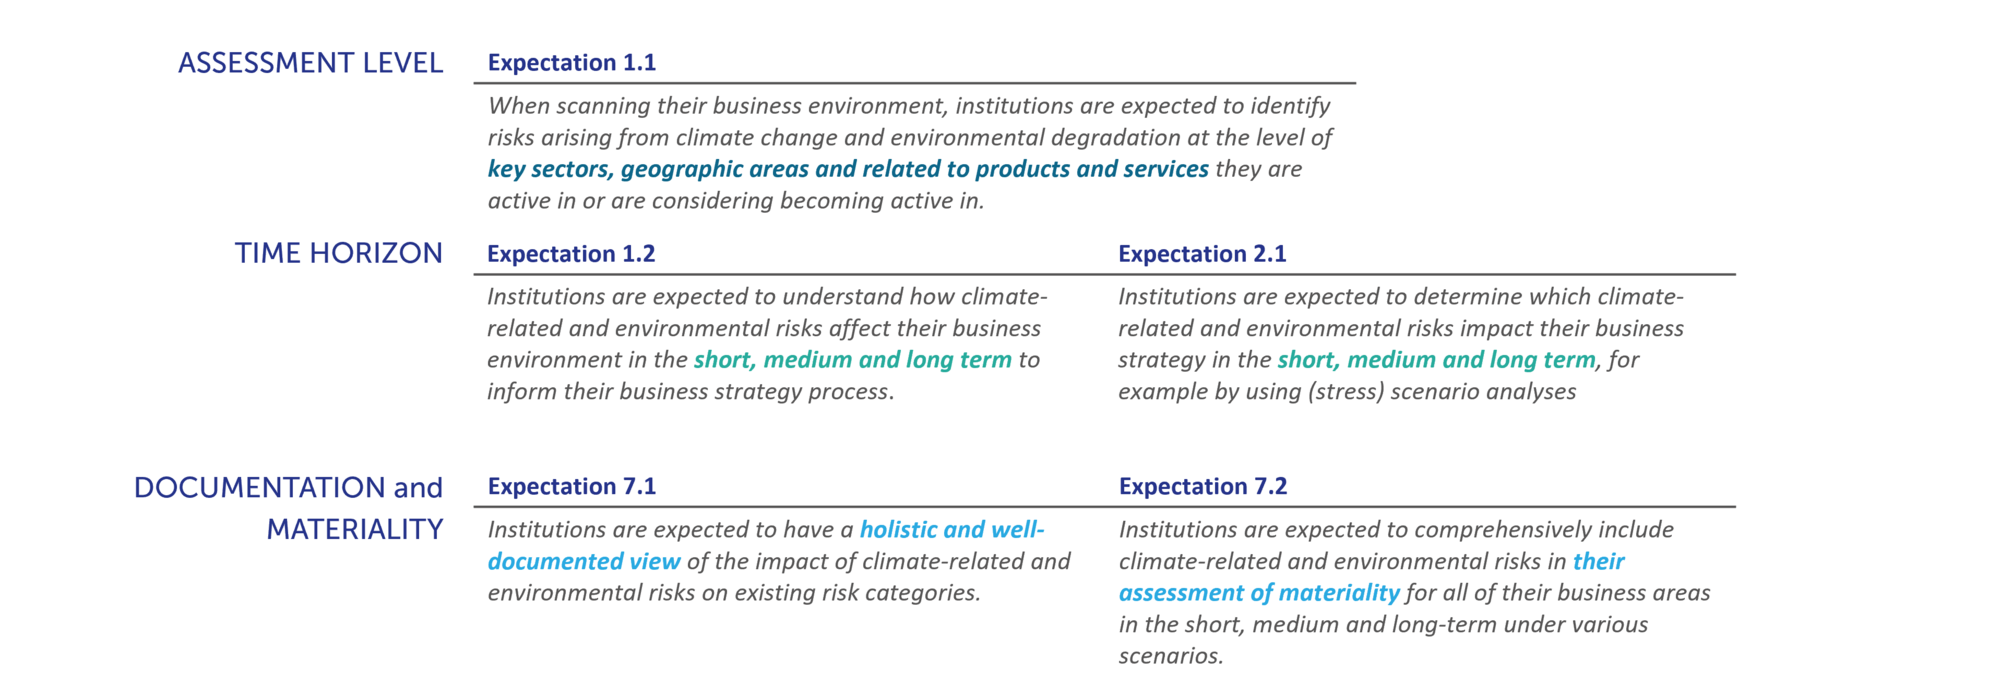
The ECB defines the expected level of granularity of the physical risk assessment (“key sectors, geographical areas and related to product and services”), the time horizon – which should cover short, medium and long term perspectives - and specifies that the quantification of the impact should be led by the internal definition of materiality to ensure that the relevant risk inventory is kept up to date accordingly to the institutions’ exposures.
Ranking of Physical Risk Assessment Methods
A further significant step in the ECB definition of a physical risk assessment framework has been made with the publication of the “Good practices for C&E risk management” in November 2022.
The Report illustrates different ways for significant institutions to align their practices with the supervisory expectations set out in the Guide.
For the purpose of this article, we will primarily focus on two aspects of the good practices reported in the paper: (i) the expected materiality assessment and (ii) the physical risk assessment methods.
The Expected Materiality Assessment
The ECB designs a three-step approach through which institutions can develop a well-informed understanding of all relevant C&E risk drivers and assess the ways in which these could affect the prudential risks they are exposed to.
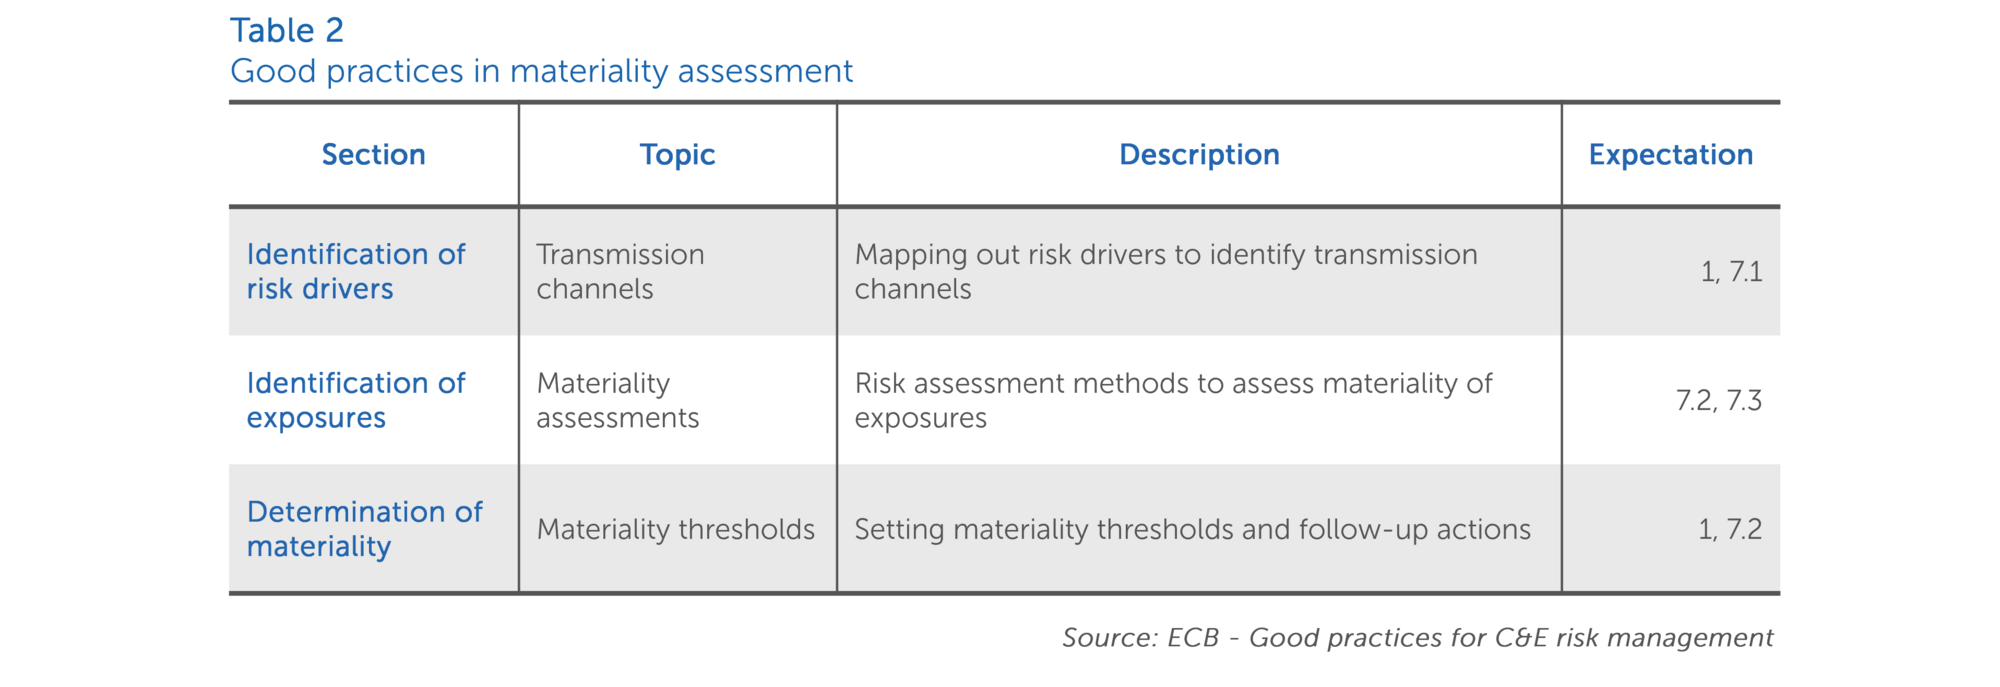
By means of a risk identification process, institutions should assess which risk drivers are – or are likely to be – material in view of their exposures. Institutions can leverage qualitative and quantitative approaches to assess the level of risk against a predetermined materiality threshold. As outlined above, institutions should use their internal definition of materiality in order to ensure that the risk inventory is kept up to date[4].
The final outcome of the materiality assessment is meant to help institutions define the required follow-up actions for integration of C&E risks in the risk management framework.
Physical Risk Assessment Methods
Depending on the type of exposure and risk driver in scope, the ECB noted that institutions deploy different qualitative and quantitative approaches to assess the materiality of the risks. They typically use qualitative approaches supplemented by proxy-based quantitative information. More advanced institutions use scenario analyses to assess the impact on either probability of default (e.g. through changes in client revenues/costs) or loss given default (e.g. through changes in the value of collateral) for exposures with credit risk or loss estimates for exposures with market risk and operational risk.
Following an increasing level of complexity, the report outlines four types of Physical Risk Analysis:
- Exposure analysis: identification of physical risk drivers by sector based on the work of an international climate research agency. Following this approach, institutions assign a sensitivity score from very low to very high to each sector taking into consideration the vulnerability of the specific economic activities (e.g. power generation) to a physical vulnerability (e.g. drought).
- Sensitivity analysis: development of several stress scenarios to assess and quantify the impact on profit and loss (P&L) of extreme weather events (i.e. droughts, heatwaves, floods). A sensitivity based simulation is performed to model the impact of shocks on individual positions, aggregating the results to determine the impact on P&L and solvency position at portfolio level.
- Business continuity analysis: identification of relevant physical risk events affecting institutions’ personnel, data, services and facilities, and using of forward-looking flood, drought and wildfire maps from external data providers.
- Collateral analysis: performing of a location-specific risk analysis to quantify physical risks using geospatial mapping and local geographical characteristics (e.g. building type, the type of surrounding terrain, the features of the construction, (public) transport routes). Using natural hazard maps (e.g. for floods, droughts and wildfires), the model constructs vulnerability curves for building type clusters at postal code level. This allows institutions to calculate risk estimates, also taking into account any general hazard protection and/or building-specific mitigation that may be in place. These risk estimates are translated into expected damages and losses to the collateral portfolio.
The Finalyse Flood Risk Prototype has been built accordingly to the ECB expectations outlined above and embraces the highest level of complexity within the Physical Risk Analysis “good practices”, by performing a collateral analysis with global coverage of the major climate-related extreme-weather hazards (Further details about the technical features of the tool will be provided later in the article). The current version of the prototype supports only river flood risk, yet further hazard types are being added.
PHYSICAL RISK ASSESSMENT
Overview
As the climate is changing, extreme events are becoming more frequent and more severe. Their importance varies across geographies and time horizons, between different industry sectors and individual borrowers.
Therefore, it is becoming crucial to define a sound approach that allows financial institutions to assess how fixed assets can be impacted by those events and to which extent this impact could further lead to changes in output and asset values, and disrupt supply chains.
Physical risks can be broken down in three key parameters to differentiate how assets are exposed to this new category of risk:
- Frequency: event-based/chronic
- Severity: the potential impact of a hazard (dependent upon the hazard type)
- Geographic coverage: the zone or area that is affected by the hazard
The Task Force on Climate-related Financial Disclosures (TCFD) distinguishes two types of physical climate risks: acute and chronic. Acute physical risks arise from changes in event-driven hazards, such as an increased severity of cyclones, hurricanes or floods. Chronic physical risks refer to longer-term, incremental shifts in climate patterns that may cause sea level rise or chronic heat waves.
The potential impact stemming from both acute and chronic events depends on the input scenarios chosen by the institution to make forward-looking and probabilistic assessments, according to a specific return period (i.e. the time horizon required so that climate change risk factors can fully materialize).
A common practice is to leverage on the scenarios prepared by The Network of Central Banks and Supervisors for Greening the Financial System (NGFS). Scenarios were first published in June 2020 and updated a year later. There are three main advantages of those scenarios:
- Scenarios were specifically designed to address the needs of prudential authorities and central banks to assess the resilience of the financial sector.
- Scenarios allow for some degree of comparability across jurisdictions because are publicly available and can be employed by multiple authorities.
- Entities can avoid having to duplicate expertise and financial resources to develop their own scenarios.
As above outlined, institutions are required to use a proportionality and materiality approach when defining their physical risk assessment and need to identify the best balance in terms of spatial coverage and resolution of the datasets, which will largely depend on the type of climate event under analysis.
Finalyse Flood Risk Prototype - Technical features
The Finalyse Flood Risk Prototype is an highly customizable tool designed to help banks in assessing and quantifying the impact of the fluvial flood risks on their exposures.
The tool is based on a probabilistic natural catastrophe impact model with averted damage calculation.
Methodological framework
According to the IPCC[5], natural risks emerge through the interplay of climate and weather-related hazards, the exposure of goods or people to this hazard, and the specific vulnerability of exposed people, infrastructure and environment.
Following this approach, physical risk can be quantified as the combination of the probability of a climate and weather-related hazard effect and its magnitude:

Where x represents a convolution of the respective distributions of probability and severity.
The severity of an hazard event can be seen as the combination between the exposure and a function of the intensity of the hazard.

This function is the so-called “impact function” which parametrizes to what extent an exposure (in the flood risk case, the property value) will be affected by a specific hazard.
Using the methodological approach described above, the Finalyse Flood Prototype is able to link the geo-spatial attributes (i.e. lat/long) of each exposures to the historical hazard maps, combine them with a set of forward-looking and probabilistic models in order to predict the future impact of the extreme-weather event. Each phase of this process will be detailed in the following sections.
Process Flow
In order to perform an end-to-end physical risk assessment exercise, the Finalyse Flood Risk Prototype follows four main steps:
- Input definition: identification of the portfolio of exposures under analysis (in currency amounts) and related geo-localization attributes.
- Hazard customization: the prototype provides historical data or model simulations and transforms them, if necessary, in order to construct a coherent event database. Stochastic events can be generated taking into account the frequency and main intensity characteristics (such as local water depth in the case of floods) of historical events, producing an ensemble of probabilistic events for each historical event category. This means that the features of the prototype are highly customizable according to the needs of the exercise to be performed.
- Impact function implementation: the impact can be defined as the combined effect of hazard events on a set of exposures mediated by a set of impact functions. By computing the impact for each event (historical and synthetic) and for each exposure value at each geographical location, the impact function provides different risk measures (e.g. % damage as a function of meters of flooding) at the desired return period.
- Output: The final output of the Flood Risk Prototype consists of a dataset at exposure level reporting the most important information (e.g. country, year, long/lat, etc..) and including the impact output (e.g. the percentage of damage of the property). The impact is eventually transferred to the credit risk parameters - by computing the impact on the Standardised Approach RWA calculation through the change in the LTV of the collateral - in order to quantify the amount of loss.
The following paragraphs will be devoted to deep dive into the two crucial phases of the prototype process flow: hazard customization and impact function.
HAZARD CUSTOMIZATION
The river flood hazard is used to describe the extreme-weather event both in terms of probability of occurrence as well as physical intensity.
In order to design a flood risk assessment, the prototype allows a high level of customization of the main hazard features, namely:
- Granularity level of hazard maps (e.g. Country)
- Climate Scenario (e.g RCP 2.6, RCP 6.0 and RCP 8.5);
- Time horizon
- Intensity at a given resolution level
The river flood risk is expressed as flood depth in meters and flooded area fraction with a footprints worldwide at 150 arcsec (approx 4 kilometers at equator) resolution (different resolutions can be set, depending on the needs).
Data are available for each (flood exposed) country worldwide and both as historical versions and a selection of IPCC representative concentration pathways (RCP) emission scenarios for selected future time periods.
Developed as part of the IPCC AR6, the Shared Socioeconomic Pathways (SSPs) are five different scenarios of socioeconomic changes up to 2100 and allow multi-disciplinary analysis within climate change research. Each SSP can be associated with one or more RCP (Representative Concentration Pathway) scenarios, which correspond radiative forcing levels in the year 2100 (expressed as W/m2) ranging from 2.6 to 8.5 which correspond to estimated rises in global temperatures of 2 degrees to above 4 degrees Celsius respectively by 2100. The prototype contains the following SSP-RCP scenarios:

Finalyse Flood Risk Prototype leverages the above using model outputs of the Intersectoral Impact Model Intercomparison Project (ISIMIP), which is an international initiative of researchers contributing harmonized global and regional climate model simulation datasets under different SSP-RCP scenarios as outlined above. It provides a simulations protocol so that different models can be compared easily given their common naming convention.
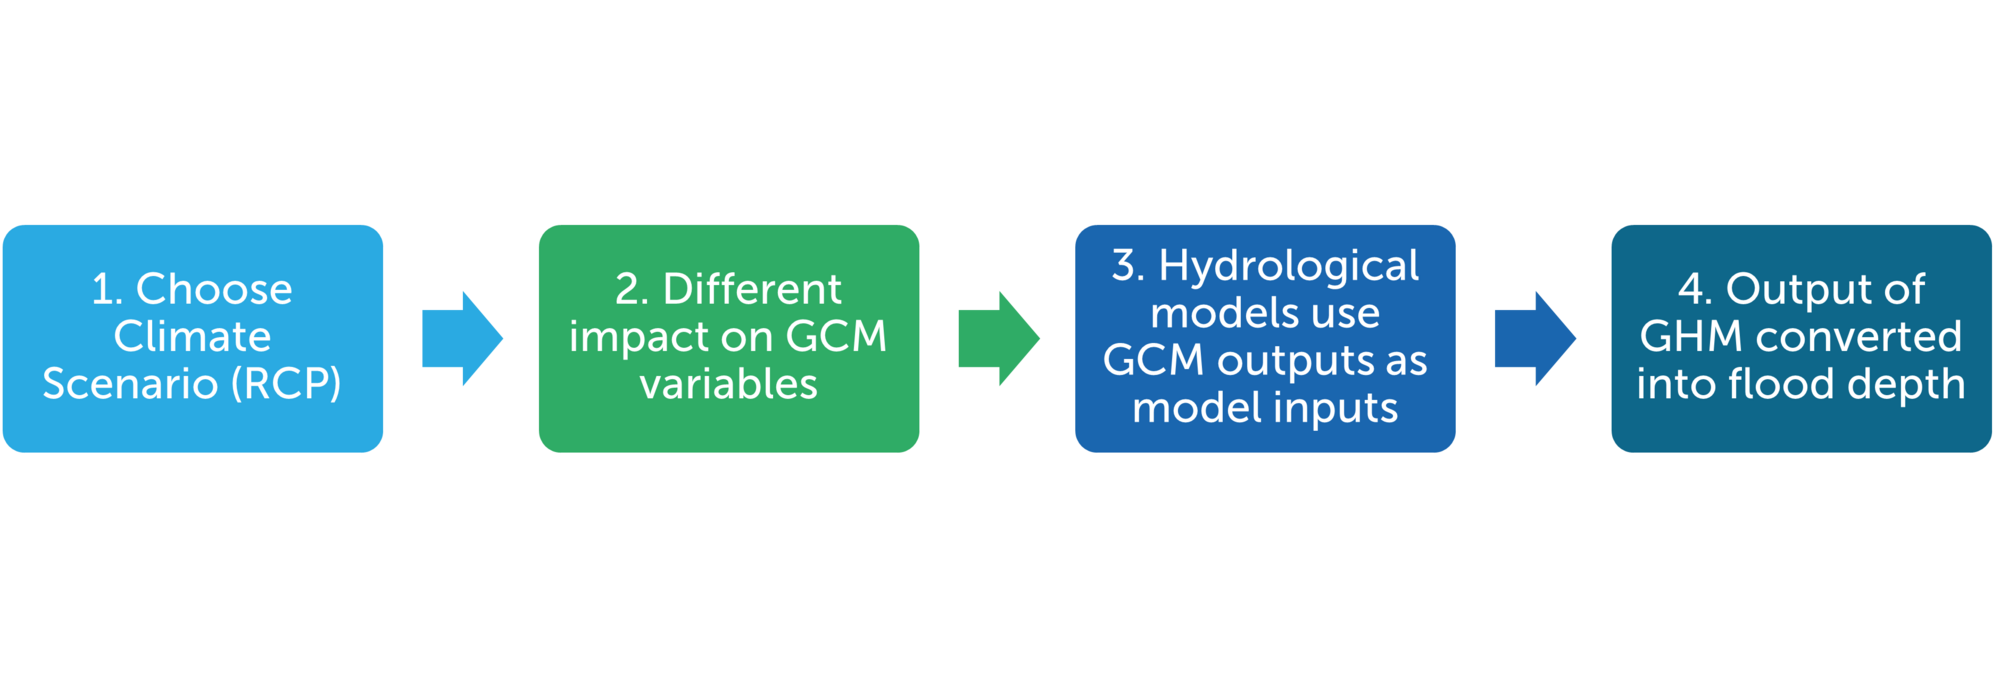
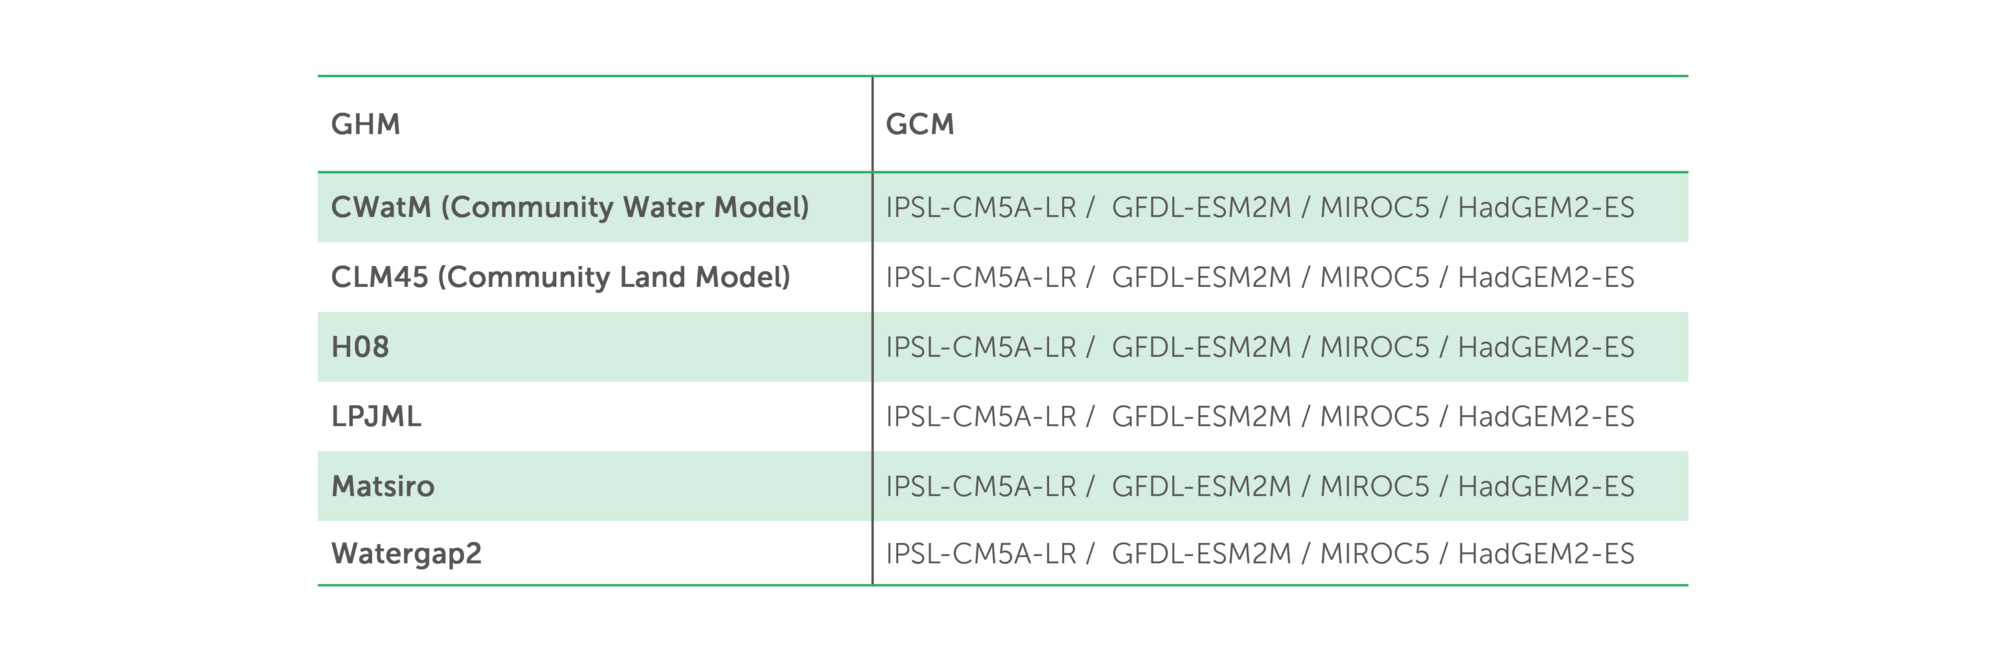
The prototype is based on ISIMIP2b model outputs, which combines 6 global hydrological models (GHMs) together with 4 global circulation models (GCMs). The hydrological models use the variables of the circulation models as inputs. In this process, variables such as precipitation, wind speed, humidity and daily temperatures stemming from the GCMs are converted into a total river runoff (m3/s). The critical element for fluvial flood risk is surface water runoff or river discharge (water that does not trickle down into the soil). This surface water runoff is finally translated into the key component:
An overview of all the different hydrological and circulation models is presented in the Annex. A detailed description can be retrieved through the ISIMIP2b protocol. [6]
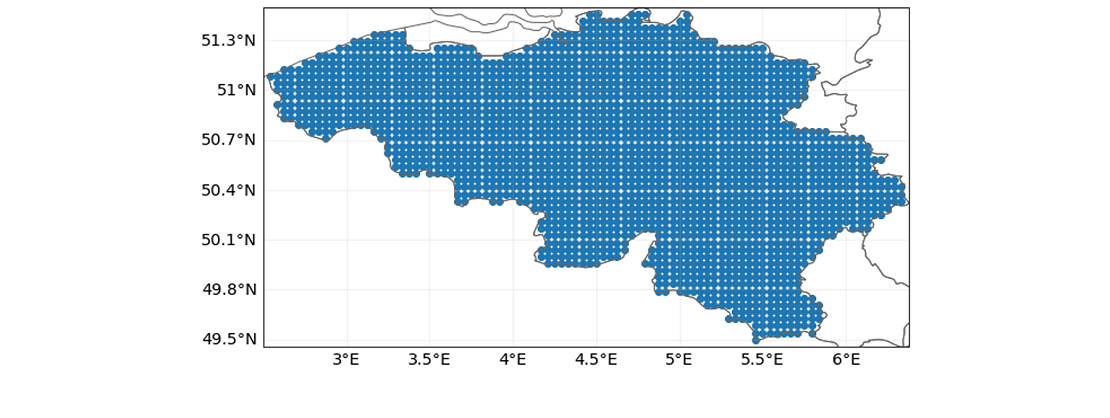
The prototype will provide for each combination of RCP Scenario, GCM and GHM the maximum intensity (flood depth, expressed in height (m)) per year for a given location. This will be done at a resolution of 150 arcseconds, which corresponds for the geographical coverage of our prototype to grids of 5km x 3km. The midpoints of these grids are called centroids and can be visualised as per below (example for Belgium).
IMPACT FUNCTION
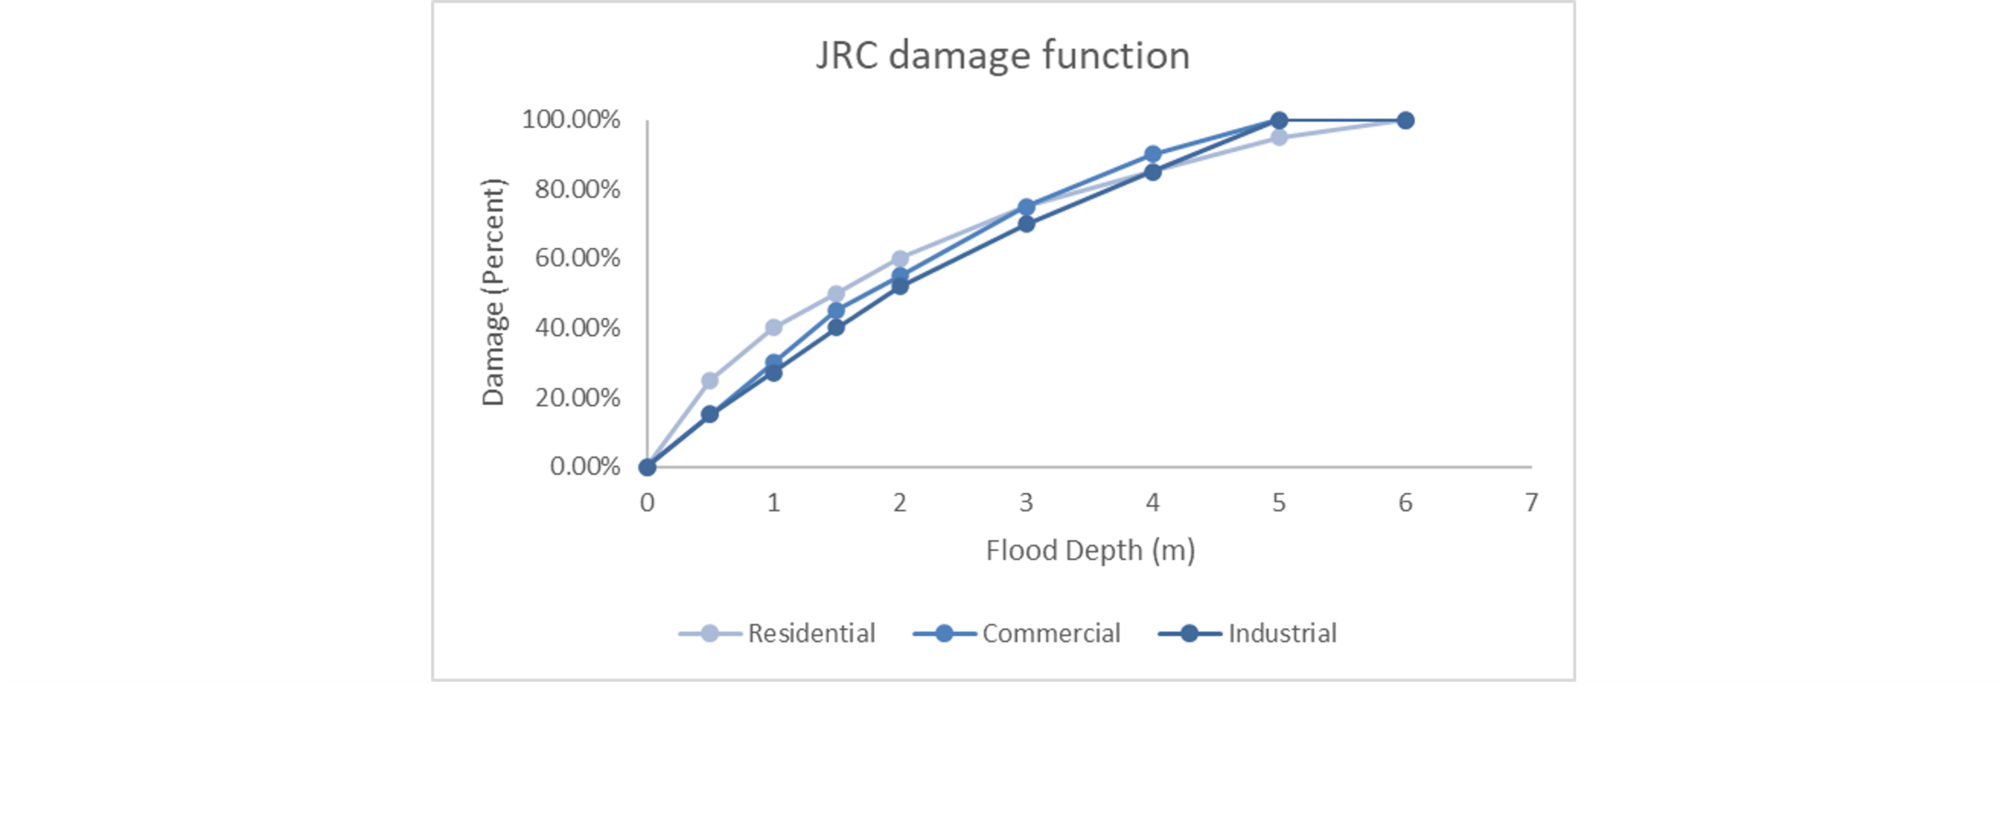
Once different flood depths have been established, a specific damage function to different types of real estate classes is created for the prototype. This is based on the methodology outlined by the Joint Research Committee (JRC) of the European Commission (Huizinga et al. (2017)).[7]
The output are so-called flood depth-damage curves which plot the maximum damage in percent terms of different asset classes for different regions. Below a graphical depiction is provided for Europe for commercial, residential and industrial assets. These values are based on regression analysis using construction data across different countries. These damage functions can be tailored further depending on specific building material and/or expert judgement.
FINALYSE FLOOD RISK PROTOTYPE - A PRACTICAL CASE
Having defined in the previous paragraph both the methodological and technical framework of the tool, the following section will show a practical implementation of the flood risk assessment created via the Finalyse Flood Risk Prototype.
Simplified portfolio view
For the purposes of demonstrating the capabilities of the prototype, we will only consider the exposure class of commercial and residential real estate mortgage loans (CRRE). Given the total amount outstanding of EUR 4.1 trillion in mortgage loans, which amounts to 33.5% of total lending towards households and non-financial companies CRRE can be viewed as one of the most important loan segments for banking in Europe[8].
The aim of the exercise is to see the impact of fluvial flood risk on capital requirements for financial institutions through the impact on their risk-weighted assets (RWA).
We will consider the Basel III Calculation of RWA for credit risk Standardised Approach, individual exposures (CRE20), in which RWA is calculated using fixed risk weights. For regulatory RRE exposures not dependent on cash flow generated by the property the following risk weights are applicable.
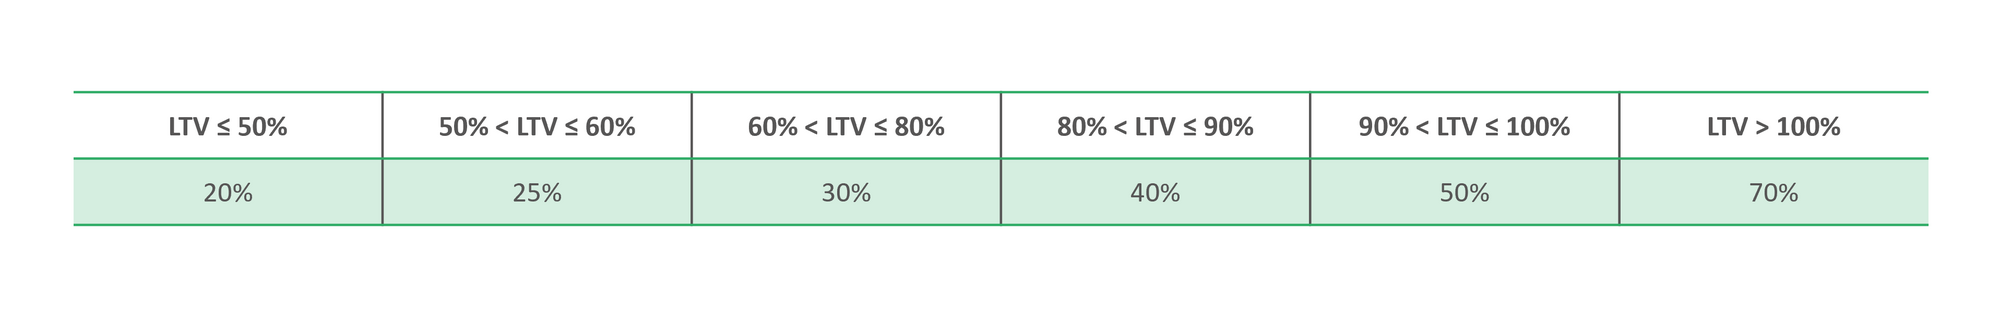
The mechanism driving changes in LTV ratios will be changes in the collateral value caused by damages of river floods.
We will start from the following simplifying assumptions:
- All exposures have a loan-to-value ratio (LTV ratio) of 70%
- Mortgage loans are treated as bullet loans: no intermediate payments made
- Maturity date is beyond the projected time intervals as shown in the next paragraph
- No discount rates are used
- Static balance sheet assumption – portfolio remains constant throughout the entire projected time range
As we assume the loan value to remain constant over time, the only imposed change is through the property value. We will focus on Belgium, the Netherlands and France during two time intervals (2030-2050 and 2050-2070) while taking into account the SSP1-RCP2.6, SSP4-RCP6.0 and SSP5-RCP8.5 climate scenarios for the purposes of the prototype. The following chapter will provide more details on the underlying climate scenarios.
Exposures mapping and impact calculation
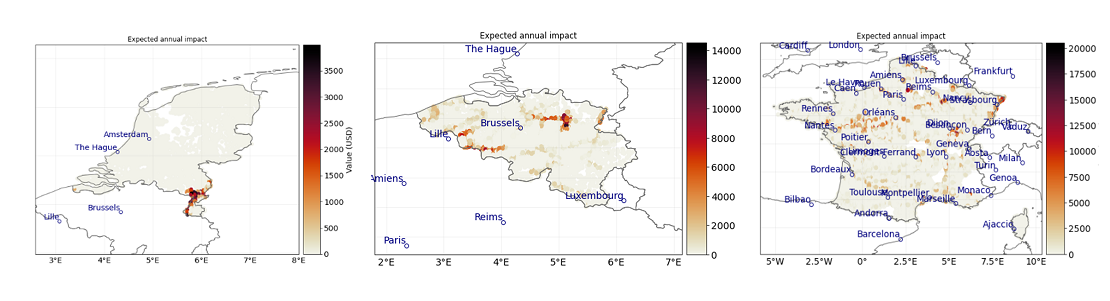
Using real estate exposures located at different communes in Belgium, France and the Netherlands we can finally combine the longitude and latitude coordinates of the centroids with the geolocations of the exposures and the damage functions. Note that the exposure values were randomized with values between EUR 100.000 and EUR 200.000.
This will yield the below output for the three countries in which the annual expected impact is provided.
The damages in absolute values can be formalized in the following manner, in which subscripts i and j denote the event and location (longitude and latitude) respectively:

The damage in absolute value terms can be expressed as function of the original exposure value e at location j, multiplied with the damage function d. The damage function takes into account hazard intensities for event i at location j given the specific vulnerability of the asset class v at location j.
Finally, an event can be described as a combination of projection years, hydrological models and circulation models. An example of an event is the flood depth for year 2055 simulated by the Community Water Model using the GFDL-ESM2M as its global circulation model.
The above definition of damages can also be seen as the severity of the risk. On the other hand we can deduct a frequency function, which is obtained from the impact exceedance curve. In the below T(x) is the return period, so 1/500 would result in a flood event that occurs once every 500 years.

For the purpose of the case study we assume that the financial institution will consider the expected annual impact (EAI) over a time horizon of 20 years, which corresponds to a typical mortgage loan term. This can be expressed as below.

Since the events all have an equal probability of occurring, the formula can be simplified to

and we consider the total amount of damages incurred over the lifetime of the mortgage loan, so we end up with the expected impact EI for a property j based on the following formula

The application of the damage function on the different exposures, using the flood risk hazard maps under the different climate pathways and for the different return periods, results in a set of changes in the exposure values (due to the impact of river flood risk) and related changes in the RWA – via risk weights.
This can be seen clearly in the formula below, in which the percentage change in RWA is expressed as the RWA after damages caused by flooding divided by the original RWA (based on our assumption of an LTV of 70%).

As the flood events lead to an increase in LTV, for some properties the risk weights will increase to 40% to even 70% depending on how large the annual expected damage is over our 20 year horizon.
The following table shows the results obtained through the application of the Finalyse Flood Risk Prototype on the exposures - as described above – for the time horizon 2030-2050:
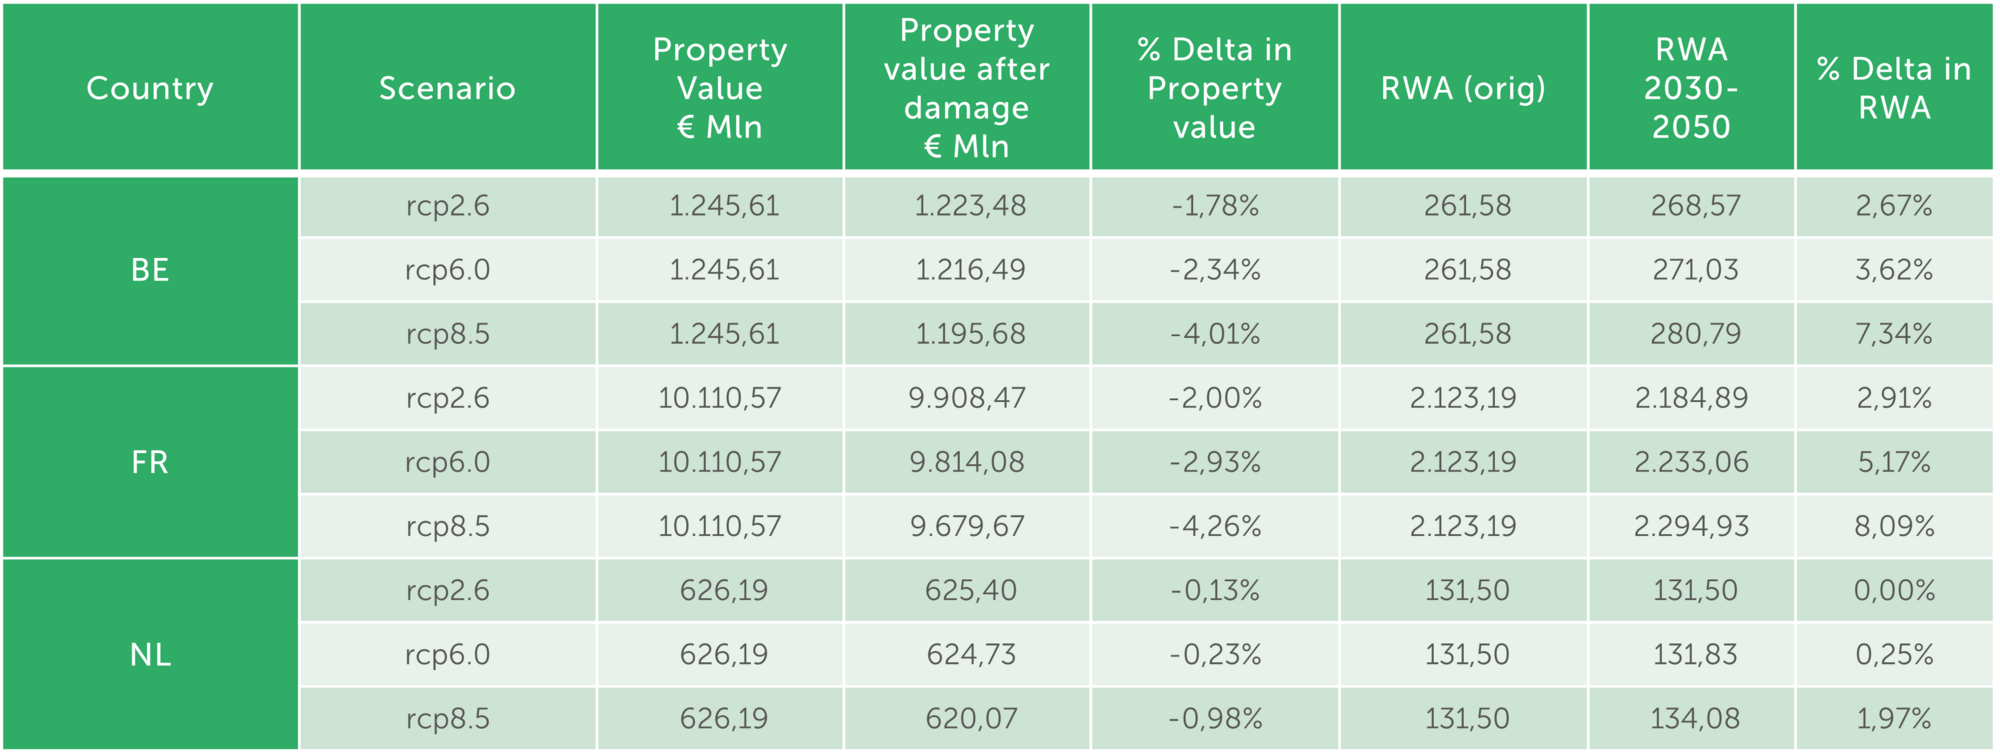
The impact on the RWA is increasing with the severity of each scenario - in terms of energy consumption based on fossil fuels - and it’s also coherent with the level of flood-sensitivity of the country.
If we consider the impacts in over a longer period of time, we can clearly observe an increase of our delta RWA over time in the different countries. This is shown in the graph below for RCP6.0 and highlights the aggravating effects of physical risk on capital requirements over time.
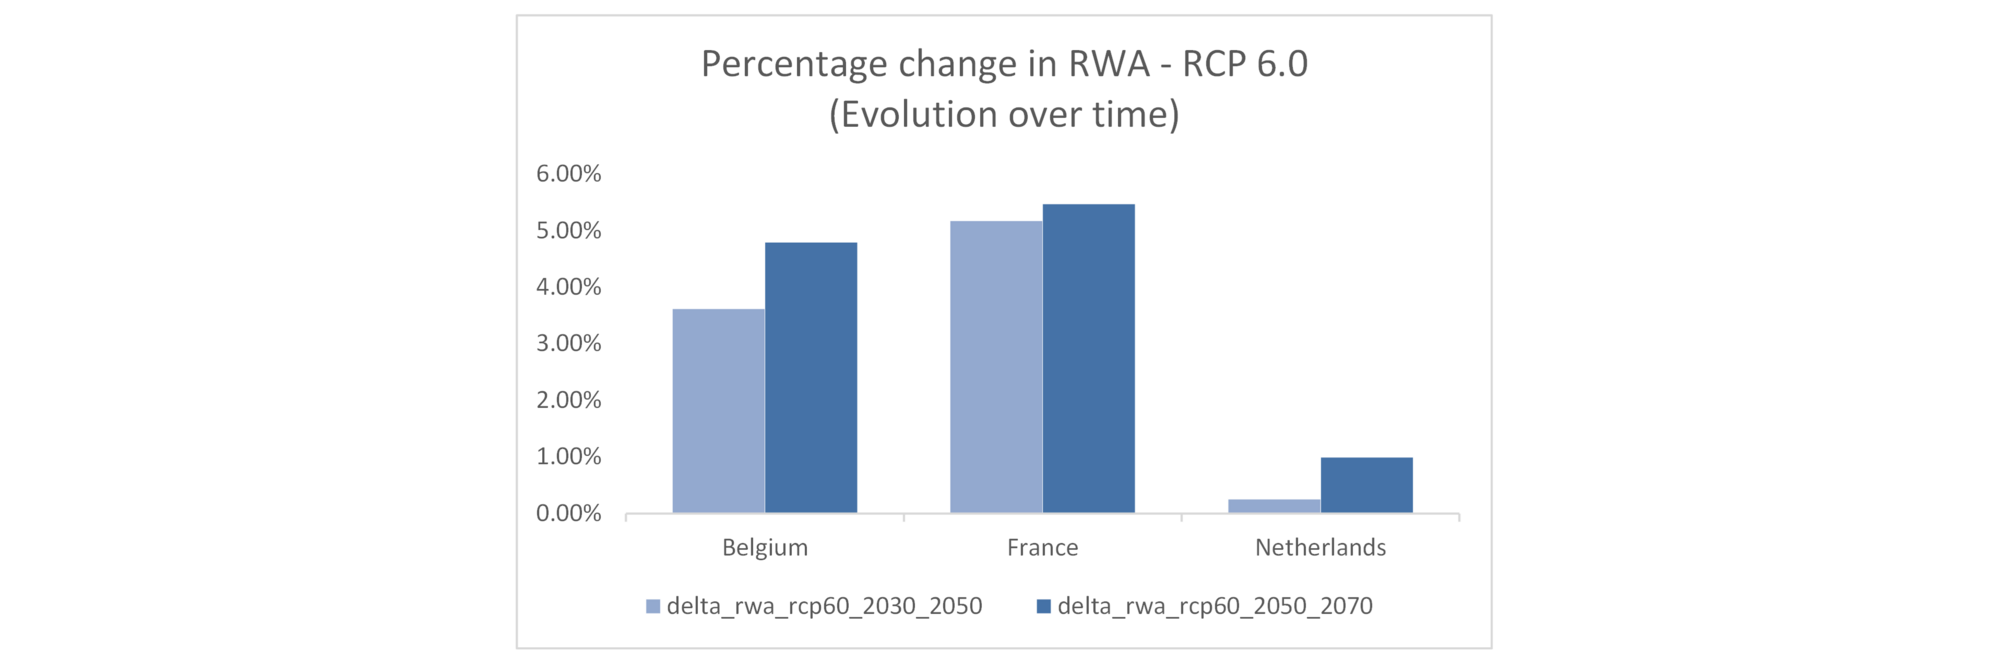
One should take into account the counterintuitive results for Netherlands, a country that is considered prone to flood risk. This has to do with the fact that in our current exercise we disregard coastal flooding and only look at fluvial flood (or river flood) risk.
One possible explanation might be the fact that the Dutch government already started in 2006 with their so-called program “Ruimte voor de Rivier”, in which exposed parts for other main river networks such as the Rhine, Waal, Ijssel and Lek were improved by providing more control areas which could catch excess river water in a controlled manner. These rivers are also fed by rain and melting water coming from the Alps through the Rhine River basin, opposed to the Meuse which is routed from France and Belgium and finally Netherlands through the more mountainous region of the Ardennes.
Since we the output relies on hydrological models, improvements in the river routing infrastructure can be taken into account which might explain the relatively low increase for the Netherlands in terms of RWA.
CONCLUSION
In November 2020, the ECB published the supervisory expectations regarding the effective management of C&E risks. Later, in November 2022, the ECB published the results of its thematic review – carried out during 2022 – and a compendium of good practices observed in some banks.
Following the publication of those two papers, Finalyse developed a prototype to demonstrate how banks should quantify their physical risks using geospatial mapping and local geographical characteristics while matching the ECB requirements (in terms of assessment level, time horizon, documentation and materiality). In a first stage, focus has been set on physical risk assessments for flooding.
The Finalyse Flood Risk prototype is now ready and offers a practical implementation of a forward-looking flood risk assessment using the ISIMIP2b simulation round of flood discharge in combination with the CLIMADA engine. The tool is therefore capable of producing an expected annual impact (expressed in currency value) at a 150 arcsec (~5km) resolution for different climate scenarios at future dates. The tool includes functionalities to geo-localise the exposures and therefore simulate expected future damages caused by floods.
The article showed a practical implementation of the Finalyse Flood Risk Prototype considering the exposure class of commercial and residential real estate mortgage loans (CRRE).
The aim of the exercise has been to assess the impact of fluvial flood risk on capital requirements for financial institutions through their Common Equity Tier 1 (CET1) Ratio - via impact on RWA.
The Finalyse Flood Risk prototype makes use of tools and methodologies that are not strictly limited to flooding. The tool will be consequently progressively enhanced to reflect more hazard types and geo-spatial coverages.
ANNEX
Overview of Global Circulation Models (GCMs) and Global Hydrological Models (GHMs)
References
[1] www.bankingsupervision.europa.eu/ecb/pub/pdf/ra/ssm.ra2019.en.pdf
[2] See par 2 for further details about the regulatory background.
[3] For further details see “Walking the talk: Banks gearing up to manage risks from climate change and environmental degradation” – ECB, Nov 22.
[4] See par 59 of the ECB Guide to the internal capital adequacy assessment process (ICAAP)
[5] Intergovernmental Panel on Climate Change
[6] ISIMIP2b Simulation Protocol (January 2021): retrieved from https://www.isimip.org/documents/564/ISIMIP2b_protocol_210131_noEnergy_IV_JS-1_IV_pmp-1.pdf
[7] Huizinga, J., Moel, H. de, Szewczyk, W. (2017). Global flood depth-damage functions.
Methodology and the database with guidelines
[8] Thematic note on residential real estate exposures of EU banks – risks and mitigants (EBA: October 2022) - https://www.eba.europa.eu/sites/default/documents/files/document_library/Publications/Reports/2022/1040827/Thematic%20note%20on%20residential%20real%20estate%20exposures%20of%20Eu%20banks%20-%20risks%20and%20mitigants%20.pdf
Finalyse InsuranceFinalyse offers specialized consulting for insurance and pension sectors, focusing on risk management, actuarial modeling, and regulatory compliance. Their services include Solvency II support, IFRS 17 implementation, and climate risk assessments, ensuring robust frameworks and regulatory alignment for institutions. |

Our Insurance Services
Check out Finalyse Insurance services list that could help your business.
Our Insurance Leaders
Get to know the people behind our services, feel free to ask them any questions.
Client Cases
Read Finalyse client cases regarding our insurance service offer.
Insurance blog articles
Read Finalyse blog articles regarding our insurance service offer.
Trending Services
BMA Regulations
Designed to meet regulatory and strategic requirements of the Actuarial and Risk department
Solvency II
Designed to meet regulatory and strategic requirements of the Actuarial and Risk department.
Outsourced Function Services
Designed to provide cost-efficient and independent assurance to insurance and reinsurance undertakings
Finalyse BankingFinalyse leverages 35+ years of banking expertise to guide you through regulatory challenges with tailored risk solutions. |

Trending Services
AI Fairness Assessment
Designed to help your Risk Management (Validation/AI Team) department in complying with EU AI Act regulatory requirements
CRR3 Validation Toolkit
A tool for banks to validate the implementation of RWA calculations and be better prepared for CRR3 in 2025
FRTB
In 2025, FRTB will become the European norm for Pillar I market risk. Enhanced reporting requirements will also kick in at the start of the year. Are you on track?
Finalyse ValuationValuing complex products is both costly and demanding, requiring quality data, advanced models, and expert support. Finalyse Valuation Services are tailored to client needs, ensuring transparency and ongoing collaboration. Our experts analyse and reconcile counterparty prices to explain and document any differences. |

Trending Services
Independent valuation of OTC and structured products
Helping clients to reconcile price disputes
Value at Risk (VaR) Calculation Service
Save time reviewing the reports instead of producing them yourself
EMIR and SFTR Reporting Services
Helping institutions to cope with reporting-related requirements
CONSENSUS DATA
Be confident about your derivative values with holistic market data at hand
Finalyse PublicationsDiscover Finalyse writings, written for you by our experienced consultants, read whitepapers, our RegBrief and blog articles to stay ahead of the trends in the Banking, Insurance and Managed Services world |

Blog
Finalyse’s take on risk-mitigation techniques and the regulatory requirements that they address
Regulatory Brief
A regularly updated catalogue of key financial policy changes, focusing on risk management, reporting, governance, accounting, and trading
Materials
Read Finalyse whitepapers and research materials on trending subjects
Latest Blog Articles
Contents of a Recovery Plan: What European Insurers Can Learn From the Irish Experience (Part 2 of 2)
Contents of a Recovery Plan: What European Insurers Can Learn From the Irish Experience (Part 1 of 2)
Rethinking 'Risk-Free': Managing the Hidden Risks in Long- and Short-Term Insurance Liabilities
About FinalyseOur aim is to support our clients incorporating changes and innovations in valuation, risk and compliance. We share the ambition to contribute to a sustainable and resilient financial system. Facing these extraordinary challenges is what drives us every day. |

Finalyse CareersUnlock your potential with Finalyse: as risk management pioneers with over 35 years of experience, we provide advisory services and empower clients in making informed decisions. Our mission is to support them in adapting to changes and innovations, contributing to a sustainable and resilient financial system. |

Our Team
Get to know our diverse and multicultural teams, committed to bring new ideas
Why Finalyse
We combine growing fintech expertise, ownership, and a passion for tailored solutions to make a real impact
Career Path
Discover our three business lines and the expert teams delivering smart, reliable support